Main Menu
- Home
- Product Finder
- Calibration Systems
- Calibration Services
- Digital Sensing
- Industrial Vibration Calibration
- Modal and Vibration Testing
- Non-Destructive Testing
- Sound & Vibration Rental Program
- Learn
- About Us
- Contact Us
The Fast Fourier Transform (FFT) can be incredibly useful in identifying key frequencies of a signal. If the signal is periodic and data is sampled over a complete period or multiple complete periods as seen in Figure 1, the FFT algorithm provides clear results.
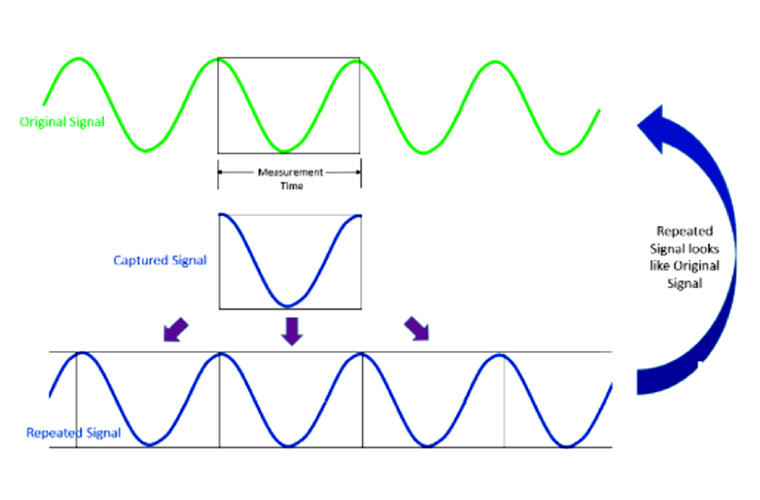 Figure 1: The captured signal happened to be periodic, and the recreated signal matches the original.
All figures courtesy of Siemens Simcenter, “ Windows and Spectral Leakage,” August 29 2019.
In practice, this is not likely to happen, so the recreated signal will contain discontinuities:
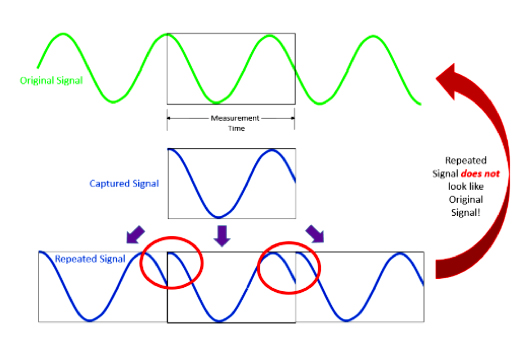 Figure 2: The captured signal is not periodic, causing discontinuities in the recreated signal.
The discontinuities cause a phenomenon known as leakage, or a “smearing” of results, making it look like energy from one frequency band is leaking into other frequency bands. Leakage can show up as high frequency components that aren’t really in the original signal.
In order to reduce the sharp transient in the recreated signal as much as possible, apply a mathematical function called a window to the data. Window functions usually start and end at zero, thereby eliminating discontinuities. Multiply the signal by the window to get a signal with no discontinuities.
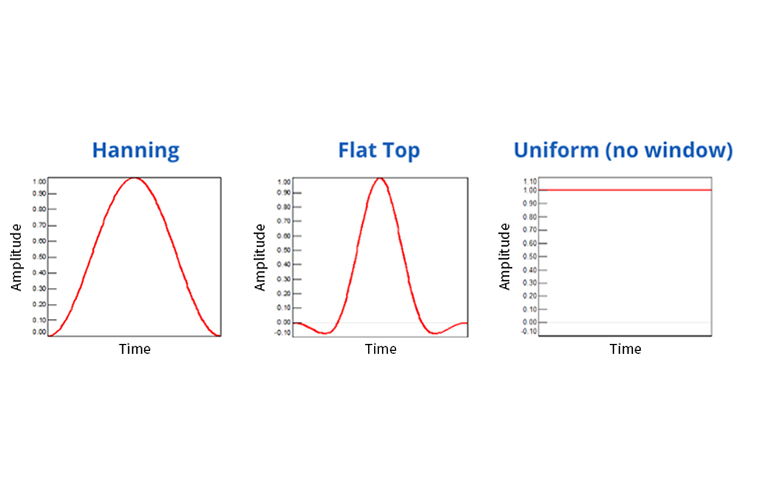
Figure 3: Time domain shape of three common window functions
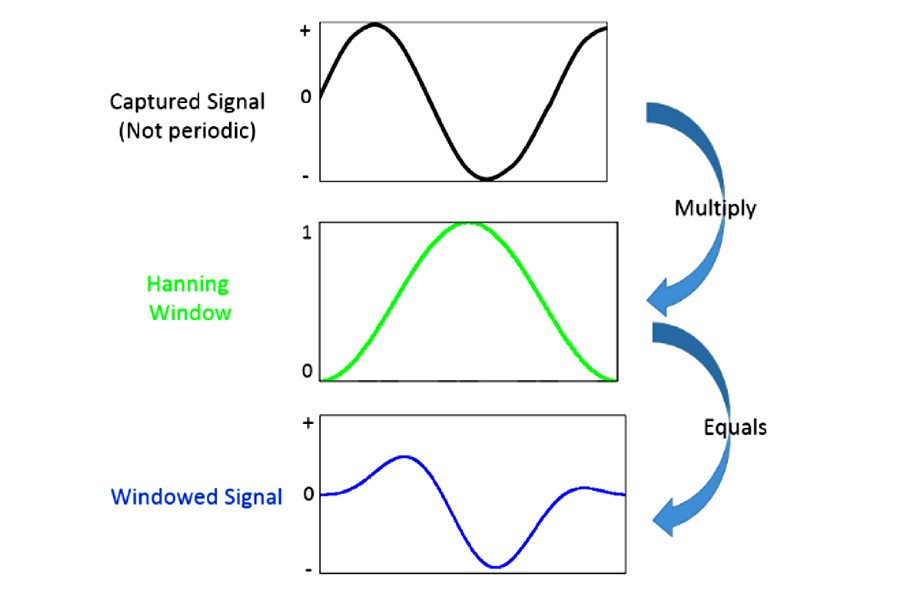
Figure 4: Applying a window to a signal
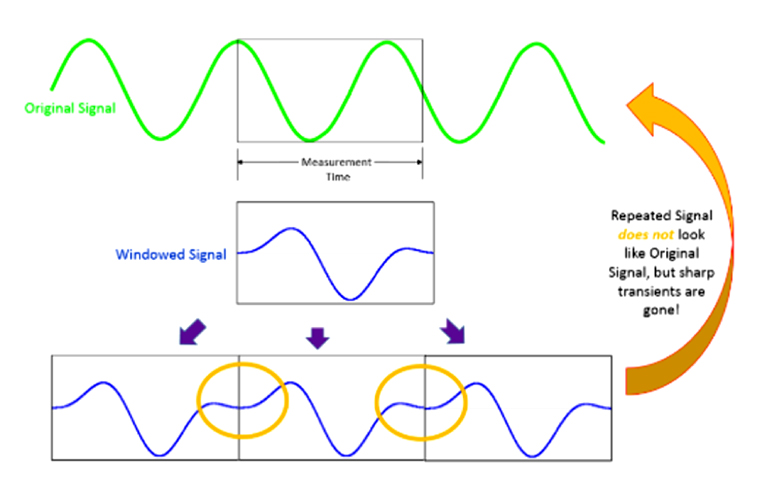 Figure 5: Result of applying a window to a non-periodic signal
The captured signal won’t be perfectly replicated, but the leakage is now confined over a smaller frequency range. There still may be leakage from the primary data bin into other bins. In other words, to make the FFT algorithm work, window functions create slightly modified signals. These modifications mean that some operations performed on the resulting data will lead to minor errors. A consequence of this is that adding up the energy of all of the bins does not give a result that matches the actual total energy level. (This type of summing of levels can be done when looking at Octave Band data, but not when looking at FFT data.)
For more information on window correction factors for amplitude and energy, see the article from Siemens, Window Correction Factors.
| Signal Type | Window | Frequency Resolution | Spectral Leakage | Amplitude Accuracy |
|---|---|---|---|---|
| Sinusoid (when amplitude accuracy is important) | Flat Top | Poor | Good | Best |
| Random | Hanning | Good | Good | Fair |
| Transient and Synchronous Sampling | Uniform | Best | Poor | Poor |
To determine the best window function to use for the application, estimate the frequency content of the signal and/or compare the performance of the different window functions.
| Application | Recommended Window | |
|---|---|---|
| General data analysis, most common (when frequency peaks are not guaranteed to be well-separated from each other) | Hanning | Good tradeoff between frequency and amplitude accuracy, reduced spectral leakage |
| Performing Calibration or other single tone amplitude measurements (when frequency peaks are likely to be distinct and well-separated from each other) | Flat Top | Excellent accuracy for amplitude |
| When signal spectrum is rather flat or broadband in frequency (broadband random, such as white noise) | Uniform | |
| Two tones with frequencies not well-separated and almost equal amplitudes | Uniform |
Sources:
Understanding FFTs and Windowing. National Instruments,
https://download.ni.com/evaluation/pxi/Understanding%20FFTs%20and%20Windowing.pdf
Windows and Spectral Leakage, Siemens PLM, 29 Aug. 2019,
https://community.sw.siemens.com/s/article/windows-and-spectral-leakage
Window Types: Hanning, Flattop, Uniform, Tukey, and Exponential, Siemens PLM, 29 Aug. 2019,
https://community.sw.siemens.com/s/article/window-types-hanning-flattop-uniform-tukey-and-exponential
Windows Correction Factors, Siemens PLM, 29 Aug. 2019,
https://community.sw.siemens.com/s/article/window-correction-factors
