Main Menu
- Home
- Product Finder
- Calibration Systems
- Calibration Services
- Digital Sensing
- Industrial Vibration Calibration
- Modal and Vibration Testing
- Non-Destructive Testing
- Sound & Vibration Rental Program
- Learn
- About Us
- Contact Us
A frequently asked question about measurements made with piezoelectric (PE) vibration sensors is related to the measurement parameters. After completing a test and evaluating data, the test engineer observes obvious signs of problems with his data, such as the decay in baseline voltage or drops in the coherence of forced response frequency response function (FRF) measurements. Many things can affect the data from a PE Accelerometer including the sensor’s measurement range, the measurand input amplitude, the measurand input frequency content, and the data acquisition sample rate. The PE accelerometer and/or the related signal conditioning affects the allowable input measurement amplitude. The measurement frequency range is determined by the data acquisition sample rate and can be amplified or attenuated (rise/rolloff) at both ends of the frequency range by the PE accelerometer/signal conditioning (Behavior of Accelerometers). Two tests are discussed here to highlight the importance of selecting the right sample rate and sensor measurement range to obtain proper results in any application.
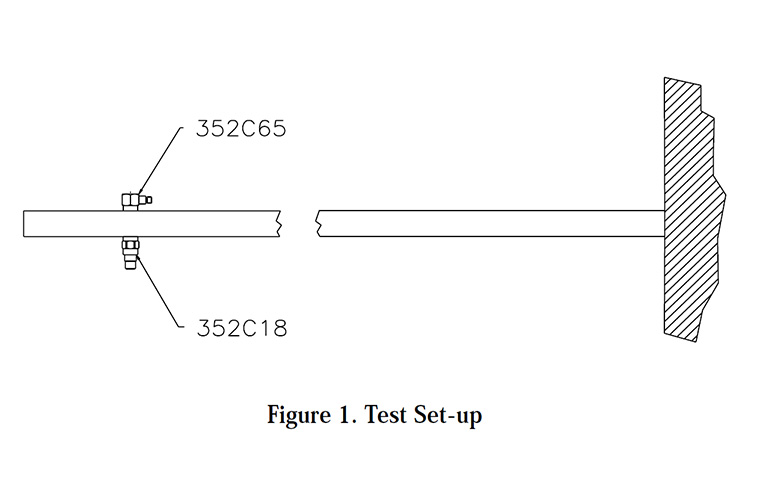
A 10 mV/g, 2-gram accelerometer and a 100 mV/g, 2-gram accelerometer were mounted to the end of a cantilever beam as shown in Figure 1. The end of the cantilever beam was impacted with a hammer to provide a step input. The outputs of each accelerometer were connected to a digital oscilloscope set at a sample rate of 2 kHz. The 10 mV/g accelerometer was also connected to a second oscilloscope set at a sample rate of 2 MHz.
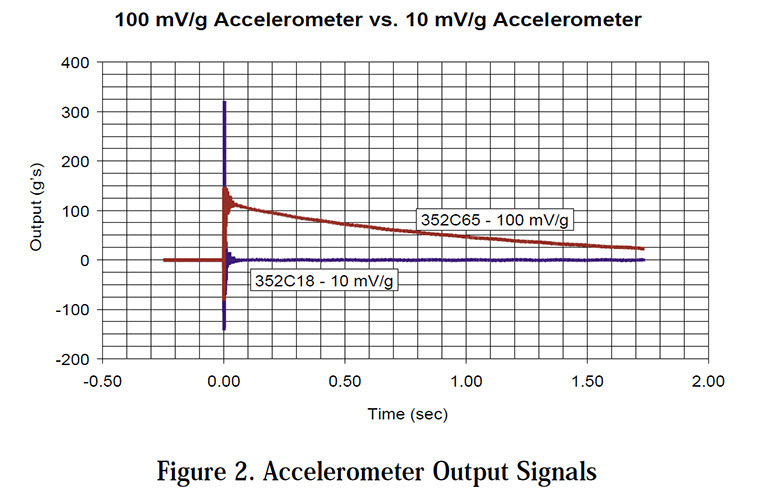
The output of the two accelerometers is shown in Figure 2 and Figure 3. Figure 2 is the output over a two second period. Figure 3 shows the same signal expanded to .01 second range. Figure 2 shows that the 100 mv/g accelerometer measured signal peaks/saturates and then exponentially decays the baseline voltage back to zero. This type of behavior indicates the input exceeded the accelerometer’s measurement range (50 g-pk) of the 100 mv/g accelerometer and saturated the accelerometer’s internal impedance converting amplifier. The erroneous peak output from the 100 mv/g accelerometer indicates the peak level was 150 g-pk and the 10 mv/g accelerometer’s measured data indicates a peak level of 325 g-pk. The lower than actual peak level measured by the 100 mv/g accelerometer is the result of the internal amplifier saturating and limiting its maximum output (which was well outside the typical 5 V IEPE linear range). The 325 g-pk output from the 10 mv/g accelerometer was well within the (5 V linear output) specified measurement range of 500 g-pk.
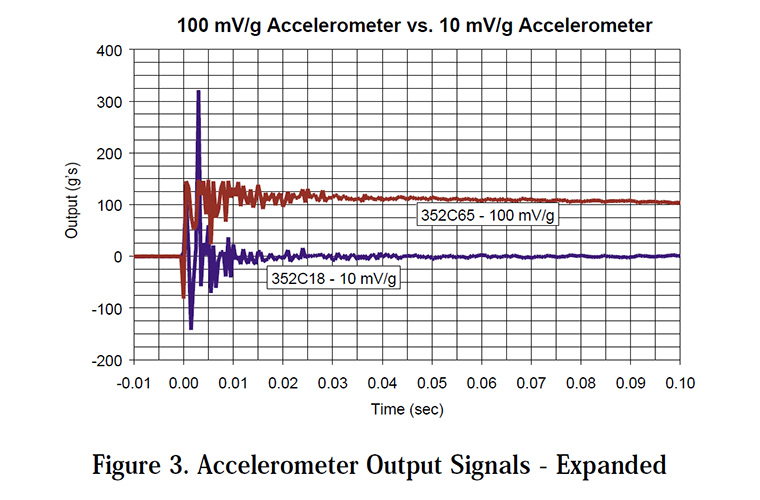
The expanded signals in Figure 3 are shown to illustrate how the levels from the 100 mv/g accelerometer differ from the 100 mv/g as the signal exceeds the 50 g-pk measurement range and saturates the higher sensitivity (100 mv/g), lower amplitude range (50 g) accelerometer. Sometimes the signal from Figure 3 could be confused with a malfunction of the accelerometer, or even worse, not even noticed if only looking at frequency domain data.
In other cases, such as a modal test by impact testing, it is important to first examine the impact and response levels at high sample rates to look for signal clipping. The high sample rates allow for good representation of the analog waveform and more easily show the telltale, flat, or clipped tops of an impulse signal. At actual measurement and analysis bandwidths of typical structural test (typically 2 kHz and below), larger time spacing between sampled points may only display a few points per impulse and easily mask signal clipping for the casual view. For more details on pitfalls and practices in impact testing, please reference Bill Fladung’s master’s thesis, “The Development and Implementation of Multiple Reference Impact Testing”.
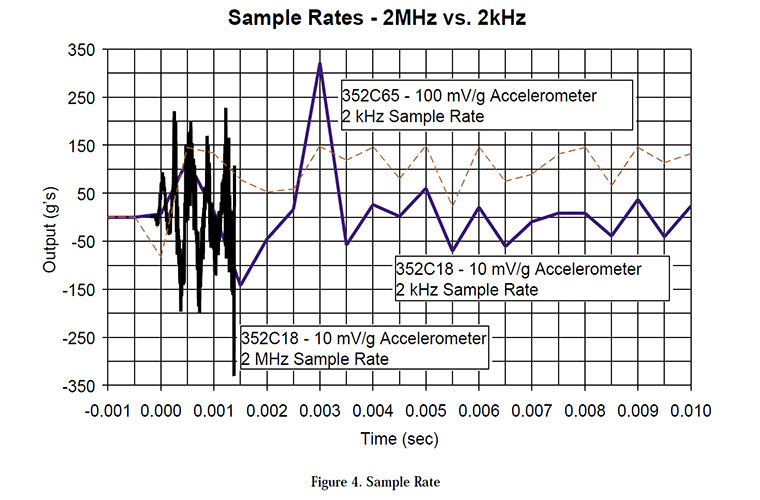
Figure 4 is a plot of the 10 mv/g accelerometer at two different sample rates of 2kHz and 2MHz. The 100 mv/g accelerometer sampled at 2 kHz is also plotted on the expanded time curve. The 2 MHz data shows a very high frequency signal resulting from the ringing of metal-to-metal impact of the hammer to steel beam. The lower 2 kHz sample rate acts as a filter on the original data and attenuates the high frequency content of the measured output levels. Without sufficient filtering on the input data, the out of band data may also alias in to the measured data adding additional error. The 2 MHz data has a peak output of over 200 g's where the maximum output on the 2 kHz data is just over 100 g's in the same time frame. When selecting a sample rate it is important to understand rudimentary digital signal processing rules like Shannon’s Sampling Theorem which require a minimum sampling of two points per cycle of the highest frequency of interest. Additional DSP concepts such as aliasing, anti-aliasing filters and Analog to Digital Converter (ADC) type of SAR or DeltaSigma are beyond the scope of this discussion but can be further investigated in a Hewlett Packard DSP Primer, Hewlett Packard Modal Testing Primer, or here for more information on ADC types and performance.
The sample rate and measurement parameters are important criteria in making an accurate measurement. The data presented was measured with integrated electronics piezoelectric (IEPE) accelerometers but are also important to measurements involving charge output piezoelectric (PE) accelerometers as well. The sample rate can actually act as a filter to attenuate the frequency content and observed peak levels, as well as masking overload/saturation occurring in a measurement. Measurement professionals are well advised to study and understand the fundamental principles digital sampling, and always have a trusted oscilloscope to view and verify various ranges of time data, especially in shock or impact environments.